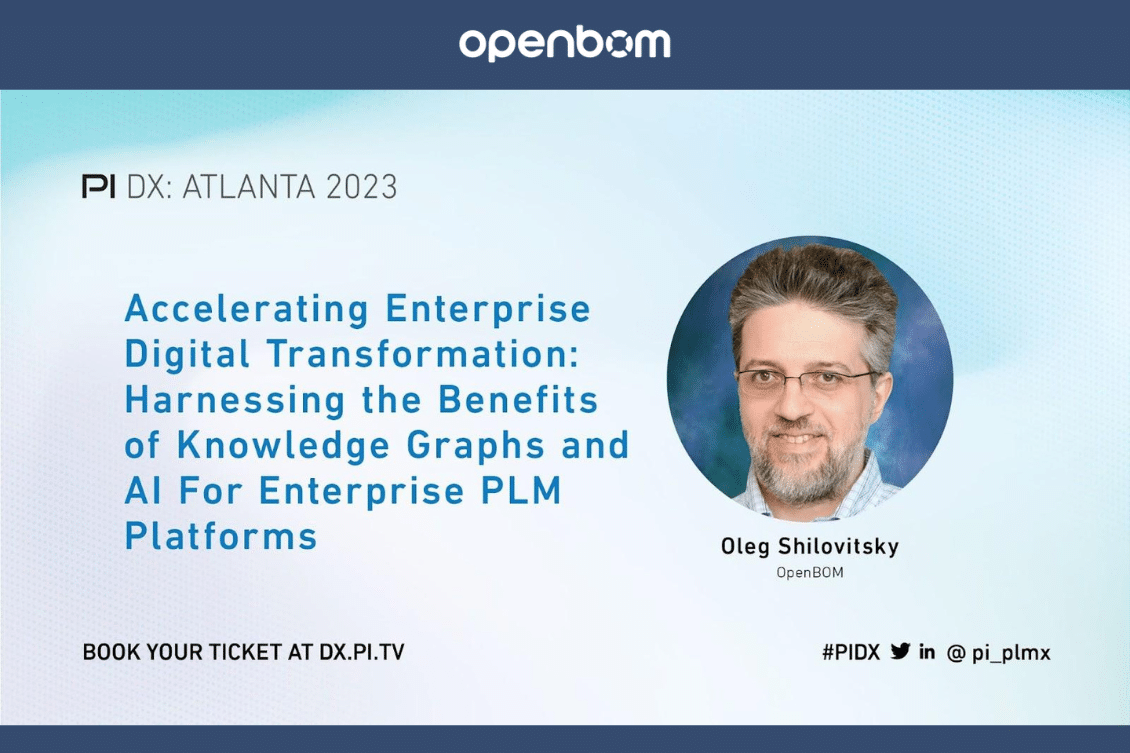
I’m thrilled to share that I’m invited to speak and share my insight at the upcoming PI DX USA 2023 event taking place in Atlanta. The conference brings together a community of visionary customers and experts to discuss PLM (product lifecycle management) trends and customer experience and it is a unique vendor-neutral event. In the past, I attended this event many times and it was always a great place to enrich an experience for all attendees. Check out more about the upcoming event and the agenda in my article – PI DX 2023 Agenda Walkthrough.
My presentation is titled “Accelerating Enterprise Digital Transformation: Harnessing the Benefits of Knowledge Graphs and AI for Enterprise PLM Platforms”. This topic couldn’t be more timely as businesses worldwide are seeking ways to accelerate digital transformation efforts to stay competitive and relevant.
Harnessing the Power of Knowledge Graphs and AI
Knowledge graphs and artificial intelligence (AI) have emerged as powerful tools for structuring and analyzing large volumes of data. In the context of PLM, these technologies can unlock significant benefits, such as improving decision-making, reducing time-to-market, and enhancing collaboration across teams. My presentation will be focusing on the basics of modern product data management, product data modeling, and business applications.
I plan to illustrate the advantages of modern product graph data modeling to transform the way it can be used to model the entire product development and related data around this model and to glean intelligence.
A Sneak Peek into the Presentation
This presentation discusses the crucial role of digital transformation in enterprises, emphasizing the utility of knowledge graphs and AI in creating an intelligent, collaborative environment for a digital manufacturing web. It outlines the challenges in digital transformation, such as data fragmentation and difficulty in data-driven decision-making. The presentation also explores how knowledge graphs integrate and structure data from various sources, aiding in accessing valuable insights. It also underlines AI’s role in automating tasks like data mapping and predictive modeling using knowledge graphs. Furthermore, it underscores the benefits of integrating knowledge graphs and AI in Product Lifecycle Management (PLM) platforms, enhancing product quality, efficiency, and cost-effectiveness.
Here are some key elements of the presentation:
- The foundational principles of knowledge graphs and AI and how they intersect with PLM.
- Best practices for implementing knowledge graphs and AI in a PLM context, including potential challenges and how to overcome them.
- The future trajectory of these technologies in PLM and what businesses can do to stay ahead of the curve.
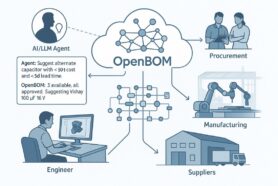
At OpenBOM, we developed flexible and robust data modeling tools helping engineering teams, manufacturing companies, and contractors to bring their data in from multiple sources and make this analysis. The foundation of the OpenBOM data model is a graph database capable to trace relationships between pieces of information and use it in multiple queries. This graph model can be used to examine multiple data points and determine the risk of any given change in order to make informed decisions.
If you never heard the word “knowledge graph”, I recommend you to check this article. It will give you some technical and business background. In a nutshell, any graph is built from nodes and A knowledge graph represents a network of real-world entities — i.e. objects, events, situations, or concepts — and illustrates the relationship between them. This information is usually stored in a graph database and visualized as a graph structure, prompting the term knowledge “graph”. A knowledge graph is made up of two main components: nodes and edges. Any object, place, or person can be a node. An edge defines the relationship between the nodes.
The power of the graph is the ability to retain the rich semantics of the data while providing a very powerful way to query the data. In the following picture, I can show you how familiar product data elements can be transformed into a graph model.
Tree of the most popular data paradigm in CAD and PLM are Files, Tables, and Trees (hierarchies). Everyone is familiar with them and they are used heavily in all PDM and PLM systems. In the following example, I can show you how information is traditionally viewed in the system.
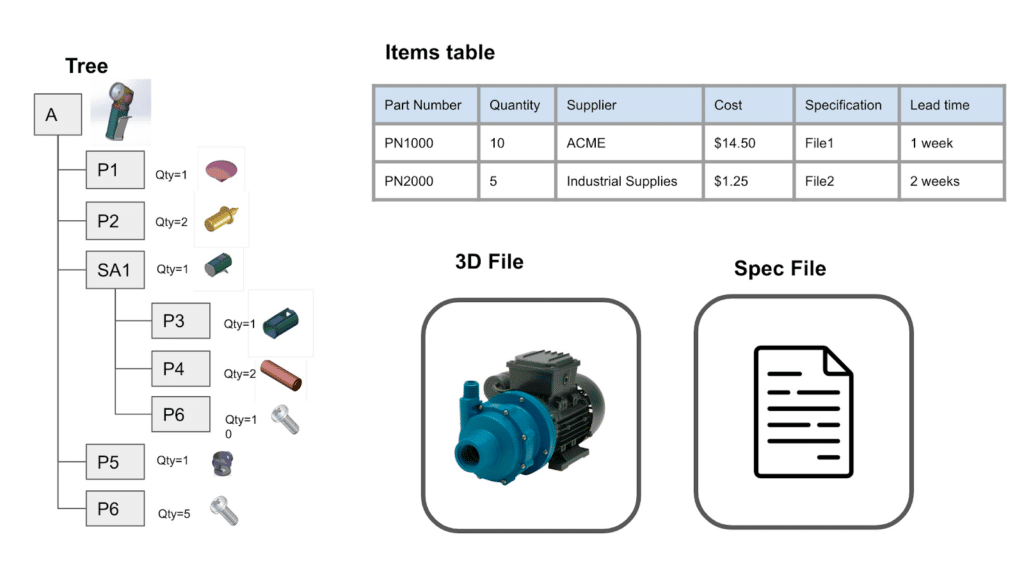
However, this information can be transformed into a graph that explains not only the data but relationships and semantic dependencies between data. The schema in the picture below is simplified. The real data is more complex. Capturing these relationships and dependencies allow for building analysis and decision-support tool to help manufacturing companies.
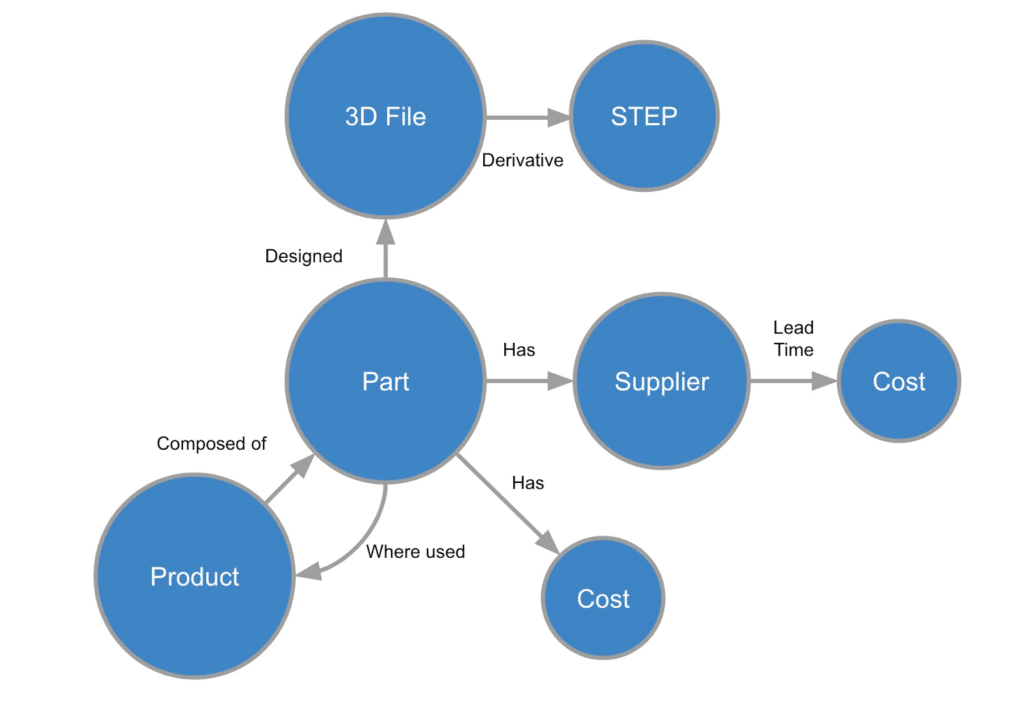
Graph model is evolving and become a foundation for future intelligence mechanisms in engineering and enterprise tech.
Conclusion and Looking Forward to PI DX USA 2023
The PI DX USA 2023 event, renowned as a hub of innovation and thought leadership, is sure to offer plenty of learning and networking opportunities. Regardless of your business role and experience, you will be able to learn more about the intersection of knowledge graphs and PLM. Stay tuned for more updates about PI DX USA 2023.
PS: As a speaker at the event, I can give free PI DX passes to people working for industrial companies interested to come to PI DX this year. Please contact me directly via email (oleg at openbom dot com) to get the discount code.
In the meantime, REGISTER FOR FREE and check how OpenBOM can help you today.
Best, Oleg
Join our newsletter to receive a weekly portion of news, articles, and tips about OpenBOM and our community.


