Earlier this week, I was talking about a new coming feature – the Graph Navigation service. It will happen this week, but today I want to talk about the future a bit more.
Today I want to talk about what is coming. We are close to unwinding the future of intelligent decisions and talking about the usage of graph data science and why it is important for future intelligent decision-making in OpenBOM.
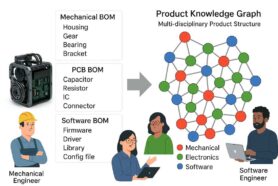
Bill of Materials (BOMs), the comprehensive structure of raw materials, parts, assemblies, and other resources necessary to construct a product, is the lifeblood of manufacturing enterprises. The most fascinating part of BOMs (or product structure) is that all elements of BOMs are deeply connected to numerous decision-making elements of the product development process such as cost, suppliers, and production planning. Due to this complexity, analyzing parts and materials across multiple purchase orders poses a big challenge for customers. At OpenBOM we started with a strong data management foundation for product structure and BOM – graph model. It brings flexibility and scale. Check out our old article – Graphs, Networks, and Bill of Materials. The important capabilities of a graph are to provide a way to share, navigate and merge different graph structures (so engineering BOM, manufacturing BOM, and many other pieces of information needed to create a final product). By using graph data models, OpenBOM solved many data management tasks such as flexible data models, data sharing capabilities, product structure management, and flexible access control.
Graphs: A Powerful Tool for Navigating BOM-related Information
The power of graphs in data science lies in their unique ability to navigate and query information related to orders in a much more efficient and user-friendly manner compared to traditional tabular databases. The interconnectedness of nodes in a graph mirrors the interconnectedness of elements in a BOM, making graph data science a natural fit for managing BOMs and complex product structures. Check out yesterday’s article about OpenBOM Graph Navigator coming in our next release.
Examples of Graph Data Science Applications in BOMs
So, what is graph data science and why do we need it? Graph data science is a technique that focuses on the analysis, modeling, and interpretation of complex data structures known as graphs. A graph consists of a collection of nodes or vertices, connected by edges or relationships. Graphs are used to represent and study various types of data, such as social networks, biological networks, transportation networks, and more. Graph data science leverages techniques from computer science, mathematics, statistics, and network science to uncover patterns, relationships, and insights hidden within these intricate graph structures.
In graph data science, you can extract meaningful information from graphs in a way you can’t with other data models. They use graph theory to explore the properties and characteristics of graphs, including centrality measures, community detection, and graph connectivity. Additionally, techniques like graph embedding and graph neural networks enable the representation and analysis of graph data in machine learning and deep learning models. By harnessing the power of graph data science, applications can gain a deeper understanding of complex Bill of Materials and product structure, make informed decisions, detect anomalies, and solve various real-world problems across different domains. In other words, finding answers to the questions – what is important, what is unusual and what is a priority for product development and supply chain?
Graph data science encompasses several important algorithms for analyzing and understanding graph structures. Centrality algorithms assess node importance based on factors such as connections, information flow, and bridging roles. Community detection algorithms uncover clusters within networks, while the shortest path algorithm finds the optimal route between nodes. These algorithms provide insights into network structure, influential nodes, information flow, and clustering patterns, contributing to the analysis and interpretation of complex graph data.
Here are examples of how Graph Data Science algorithms can be used in BOMs and purchasing processes.
- Long Lead Time Suppliers: Graphs can readily highlight suppliers with historically long lead times. This gives companies the ability to proactively adjust their ordering schedules or search for alternative suppliers.
- Deliveries at Risk: By representing supply chains graphically, we can quickly identify nodes (representing parts or suppliers) that are potential risks due to factors like predicted delays or historical unreliability.
- Long Lead Time Purchase Orders: Graphs enable clear visualization of purchase orders with long lead times, allowing procurement teams to strategize appropriately to mitigate potential delays.
- Part Shortages: With the help of graph data science, companies can easily detect and monitor part shortages. Graphs help pinpoint exactly where in the supply chain the shortage is occurring and what products it is affecting.
OpenBOM’s Intelligent Purchase Dashboard
At OpenBOM, we are actively integrating graph data science into our solutions. We are working on bringing a new graph navigator and graph model to a solution that provides intelligent purchasing aim to customers. It will allow customers to make more informed decisions related to the purchasing process. Leveraging an accurate bill of materials, it provides an intuitive, graphical representation of complex BOM data. This translates into a more comprehensive understanding of your supply chain, enhanced risk management, and ultimately, optimized decision-making.
Conclusion:
Graph navigator serves as the foundation of the new approach in purchasing intelligence, bridging the gap between complex BOM data, MBOM/Orders, and PO actions. By integrating graph data science into product models, purchasing, and supply chains, we plan to provide customers with the tools to enhance their supply chain visibility, mitigate risks, and improve their overall purchasing decisions.
Are you interested in taking part in our development and giving us feedback? Please contact OpenBOM support -we would be happy to discuss this. Please reach out to us to discuss how our new approach to BOMs might fit into your operations. With your input, we can continue refining our tools to better serve the manufacturing industry’s evolving needs.
In the meantime, REGISTER FOR FREE and start a trial to check how OpenBOM can help you today.
Best, Oleg
Join our newsletter to receive a weekly portion of news, articles, and tips about OpenBOM and our community.


