In my previous article Graphs, Networks and BOMs Part One I introduced how Graph and Networks can be used to represent Bills of Materials. Bill of Materials usually presented as lists of parts and assemblies that actually can be transformed into a very sophisticated and intelligent network structure. Using graph data representation, the theory of graphs and network maths, modern cloud data management systems can glean intelligence and information that cannot be obtained from Excels and old legacy databases.
Today, I want to give you a few examples of how the Bill of Materials can be converted from a traditional “hierarchical” view into a “graph” view and what advantages it can bring to anybody who will use it.
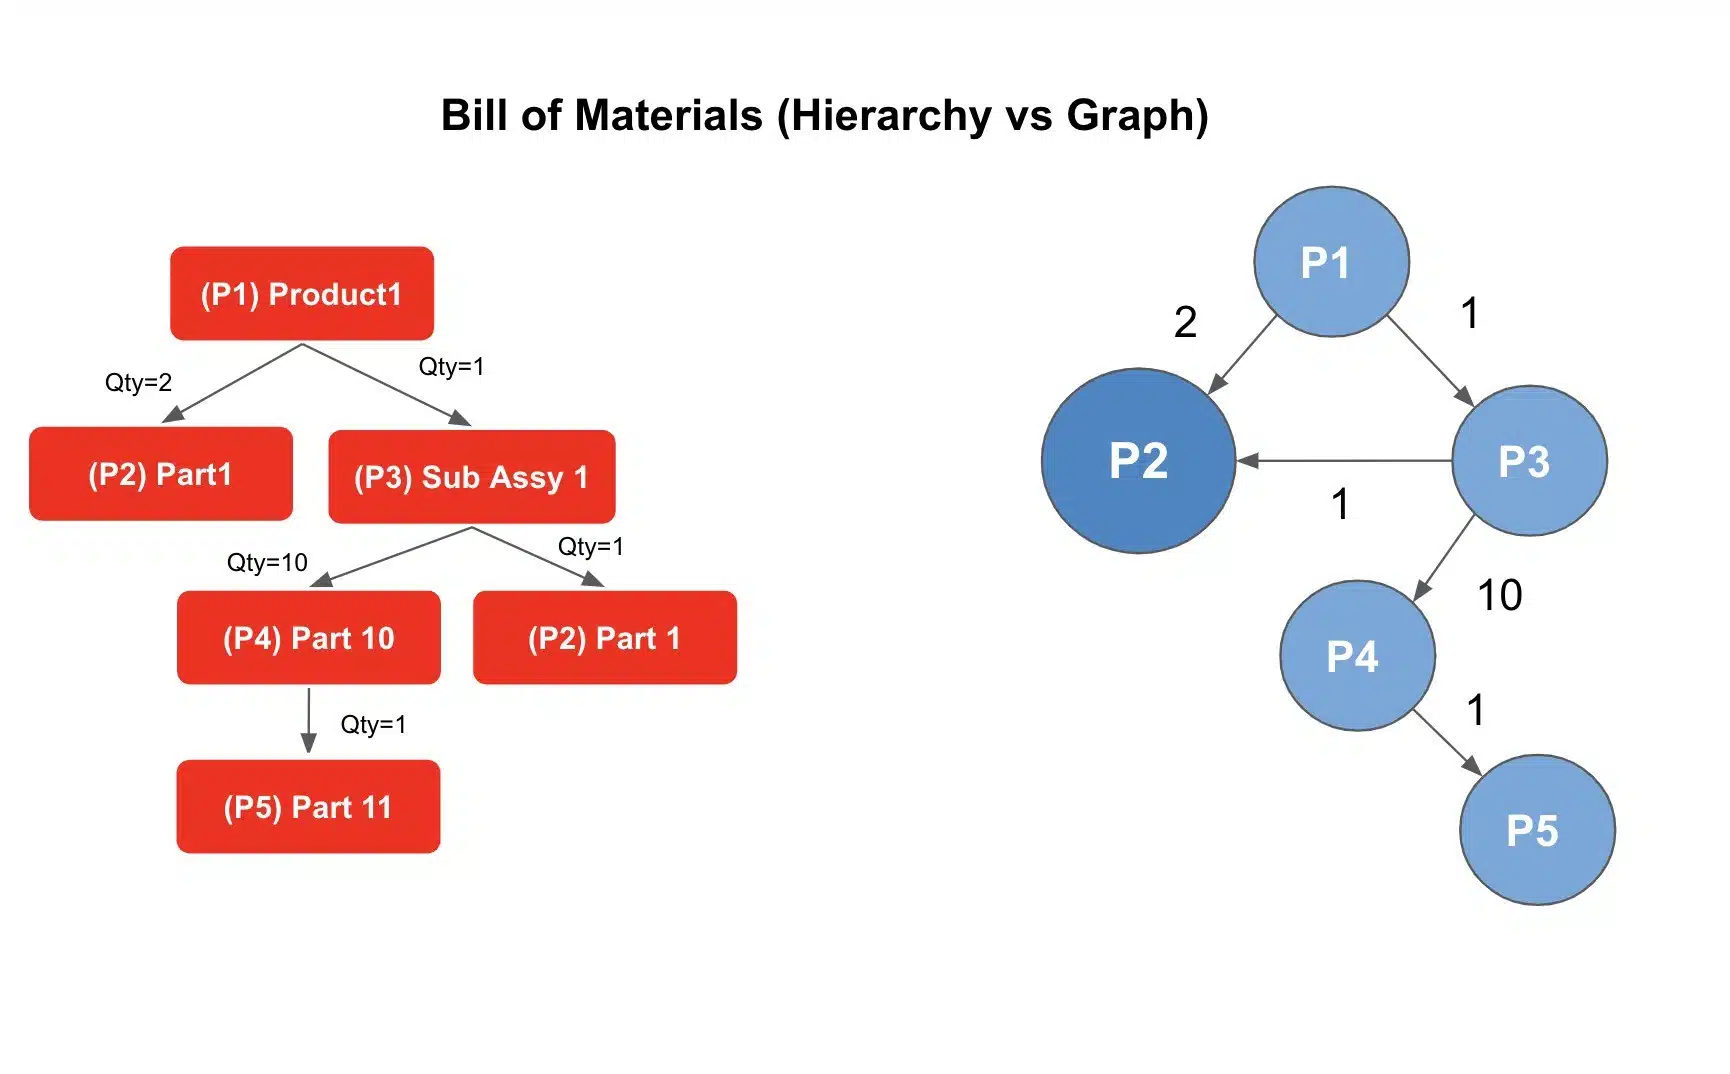
The main thing that will help you to think about the Bill of Materials as a graph is the process of translation from a hierarchical view into a network diagram. In the following picture you can see one product (BOM) is transferred into a graph.
I combined each component in hierarchical structure into a node and connected nodes with edges, while placing Qty of each component used as an attribute of the edge. What you can see is that some of the nodes are used more than one time. I’ve drawn it (P2) as a bigger node and made it darker.
Now, let think about what will happen if we will bring 2 BOMs and combine them together in a single graph. We will use the same principle of combining some information such as frequency of the node (part usage) and also will use the thickness of the edge to express the number of products (BOM) a specific part is used.
Here is the result.

OpenBOM creates a graph representation of all Bill of Materials in the OpenBOM platform by applying graph technology and graph databases. Each time user is creating bill of materials, a corresponding graph model is created and it allows OpenBOM to provide basic operations on the Bill of Materials (eg. Where used queries). But it is just the first step of the graph and network utilization. Advanced analysis of the Common BOM graph can provide an insight into the dependencies between supplies, contractors, vendors, component usage and many others.
Conclusion
The network (graph model) artifact created as a result of a combination of multiple Bill of Materials can provide a model for the analysis of product information and dependencies between objects used to represent this graph. While the graph itself is an abstract model, by combining a graph model and semantic information about products (Eg. vendors, suppliers, manufacturing time, engineers, locations, etc) we can create a variety of models for decision making, product manufacturing options, component trust, and many others.
I will talk about it in my next (final) article about Graphs, Networks, and Bill of Materials. Please stay tuned.
Best, Oleg @ openbom dot com.
Want to learn more about PLM? Check out my Beyond PLM blog and PLM Book website
Read OpenBOM customer reviews on G2 Crowd to learn what customers are saying about OpenBOM.
Join our newsletter to receive a weekly portion of news, articles, and tips about OpenBOM and our community.