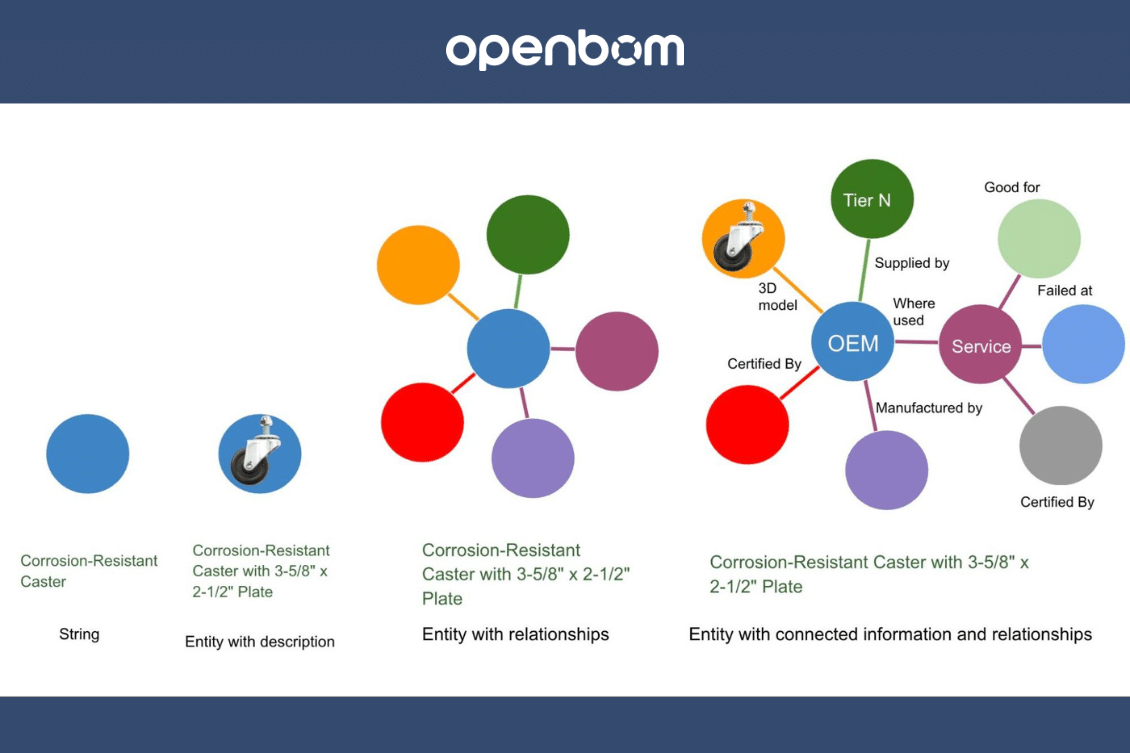
The complexity of modern engineering and manufacturing is unprecedented these days. While companies demand to develop product better, faster, and cheaper, the real question remains, what technologies can help them to do so? Digital Thread is quickly becoming one of the leading mechanisms companies can use to maintain complex semantic relationships between different product elements.
While PLM was always focused on how to manage complex data, the underlining SQL databases are one of the most painful technological limitations to managing the full richness of complex semantic relationships and supporting the scale needed in modern manufacturing complexity.
When we started OpenBOM, we were thinking about how to solve the problem of managing complex relationships in a flexible way. That was one of the reasons why we decided to use Graph Database as part of the OpenBOM foundation. Read more about it here – Why OpenBOM is using Graph Database?
While we are using Neo4j as a foundation of OpenBOM from day one, now we would like to bring the power of graphs not only to the core data management foundation but also to user experience. Hence we are working to introduce a new module – Graph Navigation in OpenBOM. In my article today, I want to give you a first live preview of OpenBOM’s Product Structure Graph Navigation. But before diving into the details, let’s explore why graphs have become a cornerstone in the realm of modern manufacturing systems.
The Relevance of Graphs in Modern Manufacturing Systems
As the manufacturing world continues to evolve, the ability to understand, visualize, and manage complex systems has become crucial. This is where graphs come into play. They allow us to represent various components and their relationships in a visual, intuitive manner.
Graphs enable engineers and manufacturers to map out a product’s structure, from its smallest components to its complex subsystems, providing a holistic picture of the product. This can greatly facilitate problem-solving, improve efficiency, and allow for more effective collaboration among different teams.
Moreover, in an age of data analytics and decision support, graph data science is a powerful set of analytics that can unlock a set of new innovative solutions and help manufacturing companies answer the most difficult questions – What’s important, What’s unusual, What’s next?
Back in 2021, Gartner identified the top 10 most important technologies for data analytics and decision support. Check more here. Graph Database is one of them. Here is a very interesting passage:
Trend 8: Graph Relates Everything. Graphs form the foundation of many modern data and analytics capabilities to find relationships between people, places, things, events and locations across diverse data assets. D&A leaders rely on graphs to quickly answer complex business questions which require contextual awareness and an understanding of the nature of connections and strengths across multiple entities. Gartner predicts that by 2025, graph technologies will be used in 80% of data and analytics innovations, up from 10% in 2021, facilitating rapid decision-making across the organization.
The Role of Graphs in OpenBOM’s Digital Thread Management
At OpenBOM, we believe in harnessing the power of graphs to manage relationships and provide a full digital thread. This is crucial to maintain the integrity of the product lifecycle, from design through production to maintenance.
OpenBOM’s graph-based approach enables it to represent complex relationships between parts, assemblies, and systems. This allows for a thorough understanding of the dependencies and interactions among various components. It also facilitates the tracking of changes across different product versions, ensuring the accuracy and consistency of information.
Why OpenBOM Chose Graph Database
The choice of a graph database for OpenBOM is a strategic one. It allows us to model complex, interconnected structures that are often found in modern manufacturing systems.
Graph databases offer superior performance when dealing with complex, many-to-many relationships, which are common in manufacturing. They also provide a high degree of flexibility, allowing for the easy addition and modification of nodes and relationships.
Moreover, graph databases are particularly well-suited for queries that involve traversing these relationships, such as finding all the components that make up a particular assembly, or identifying all the assemblies that use a particular component.
The First Version of Graph Navigation with “Where Used” and “Composed Of” Relationships
We’re excited to reveal the first version of OpenBOM’s Product Structure Graph Navigation. This innovative feature allows you to navigate the product structure graph, visualizing and understanding complex relationships in an intuitive way.
The “where used” and “composed of” relationships are fundamental in any product structure graph. The “where used” relationship allows you to see all the places where a particular component is used. This can be crucial in scenarios such as change management or impact analysis.
On the other hand, the “composed of” relationship allows you to see what components make up a particular assembly, aiding in tasks like cost estimation or inventory planning.
And here is the video:
Exciting Features on the Horizon
We’re just getting started! The future of OpenBOM’s Product Structure Graph Navigation will see the inclusion of custom objects and custom relationships. This will allow users to create their own types of nodes and relationships, offering even more flexibility and personalization.
In a world where customization and adaptability are paramount, we are confident that these upcoming features will revolutionize the way modern manufacturing systems operate. Stay tuned for more advancements as we continue to push the boundaries of what’s possible in manufacturing with OpenBOM’s Product Structure Graph Navigation.
Conclusion:
Graphs are powerful and intuitive. Bringing the graph navigation paradigm to OpenBOM will make the OpenBOM user experience easier and will allow unlocking to capabilities of navigating different elements of digital thread natively from the OpenBOM user interface.
OpenBOM was always on the edge of exploring how to bring a powerful and easy-to-understand user experience paradigm to customers. This is how we decided to use a “spreadsheet-like” user experience, images, and many others. Graph Navigation will be the next one.
A few user experience paradigms impacted significantly OpenBOM’s Product Structure Graph Navigation, it is a game-changer, offering an unprecedented level of clarity, efficiency, and customization in the manufacturing industry. By harnessing the power of graphs and graph databases, we are able to visualize and manage complex systems in an intuitive and streamlined manner. The “where used” and “composed of” relationships bring significant value, enhancing tasks such as change management, impact analysis, cost estimation, and inventory planning. Furthermore, the future incorporation of custom objects and custom relationships will provide an even greater level of flexibility and personalization, ensuring that OpenBOM remains at the forefront of manufacturing technology.
In the meantime, REGISTER FOR FREE and check how OpenBOM can help you today.
Best, Oleg
Join our newsletter to receive a weekly portion of news, articles, and tips about OpenBOM and our community.


