What Is The Global BOM Graph?
Most people in the manufacturing world are likely familiar with the term “Bill of Materials” or BOM. A BOM is a comprehensive list of all the components and raw materials that are needed to make a product. But what about the global BOM? The global BOM graph shows the flow of parts and materials across countries and regions in order to create finished products. By tracking the movement of parts and materials, businesses can identify areas where they can improve their supply chain and optimize their production processes. The global BOM graph is a valuable tool for manufacturers around the world.
Why Graphs?
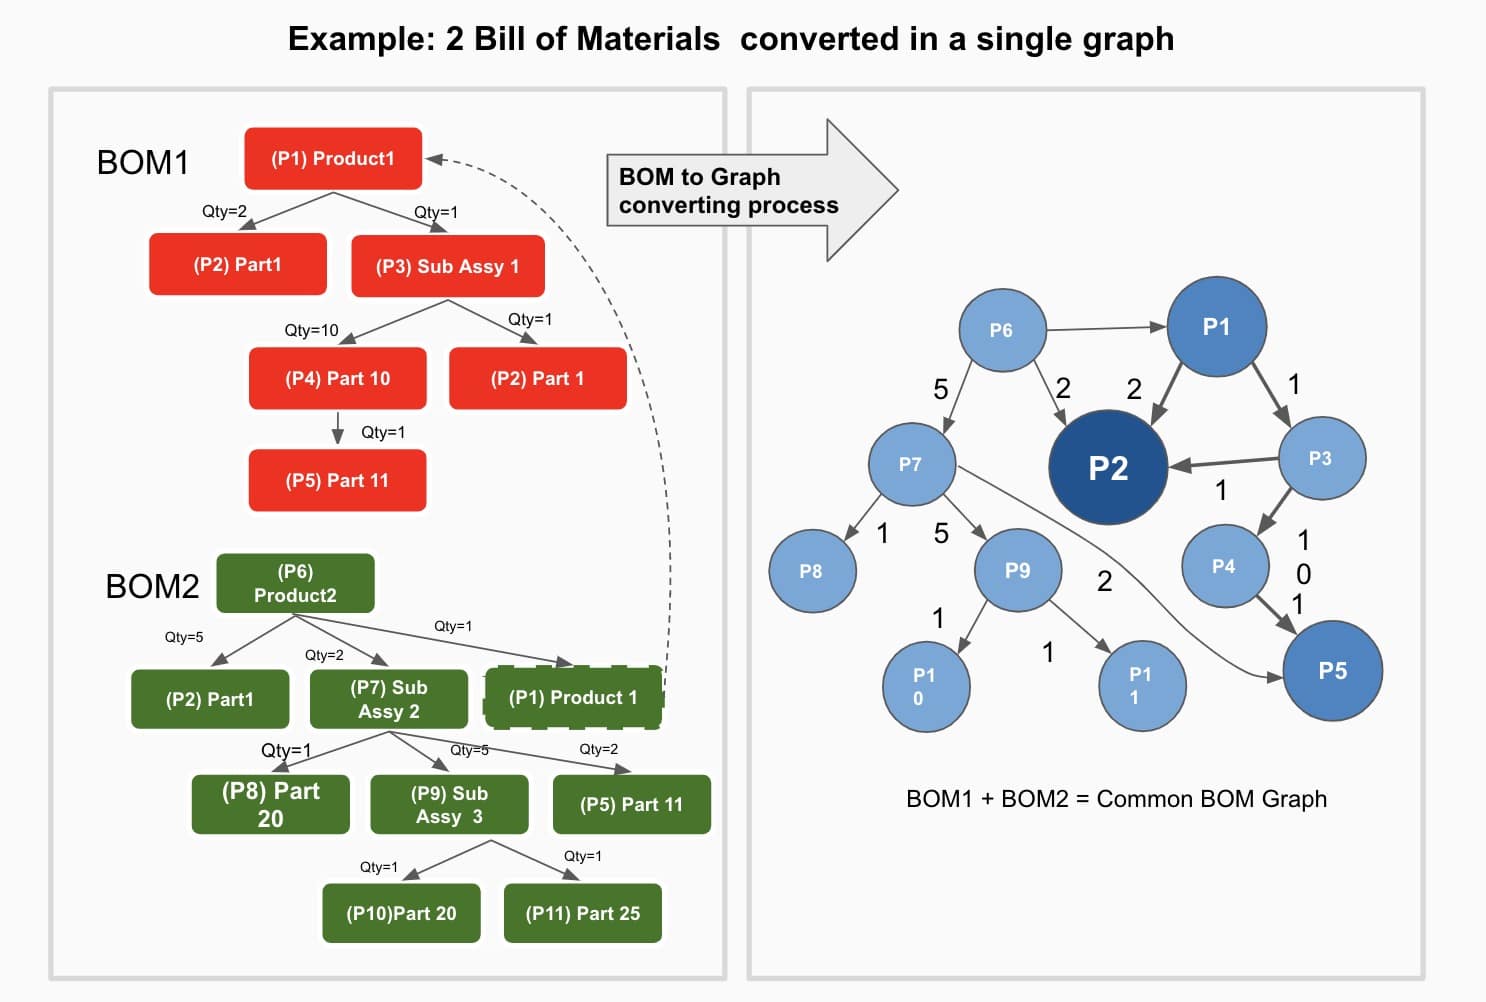
In the previous articles, we’ve been talking about graphs and BOMs. Please check the following few links: BOMs and Graphs Part 1; Part 2 and Part 3. Although the Bill of Materials and product structure is usually presented in hierarchical ways, in fact, when it comes to multiple products, assemblies, and components, the data in product structures creates a complex structure that can be presented by graphs.
The novelty of the graph approach in product lifecycle management and BOM management allows building a new type of applications, especially for data analytics and data intelligence. Using graph data representation, the theory of graphs, and network maths, modern cloud data management systems can glean intelligence and information that cannot be obtained from Excels and old legacy databases. In my earlier article – Graph Centered applications, I discussed different types of applications and business use cases around them that can be applied for product development and manufacturing companies.
What is the global BOM graph?
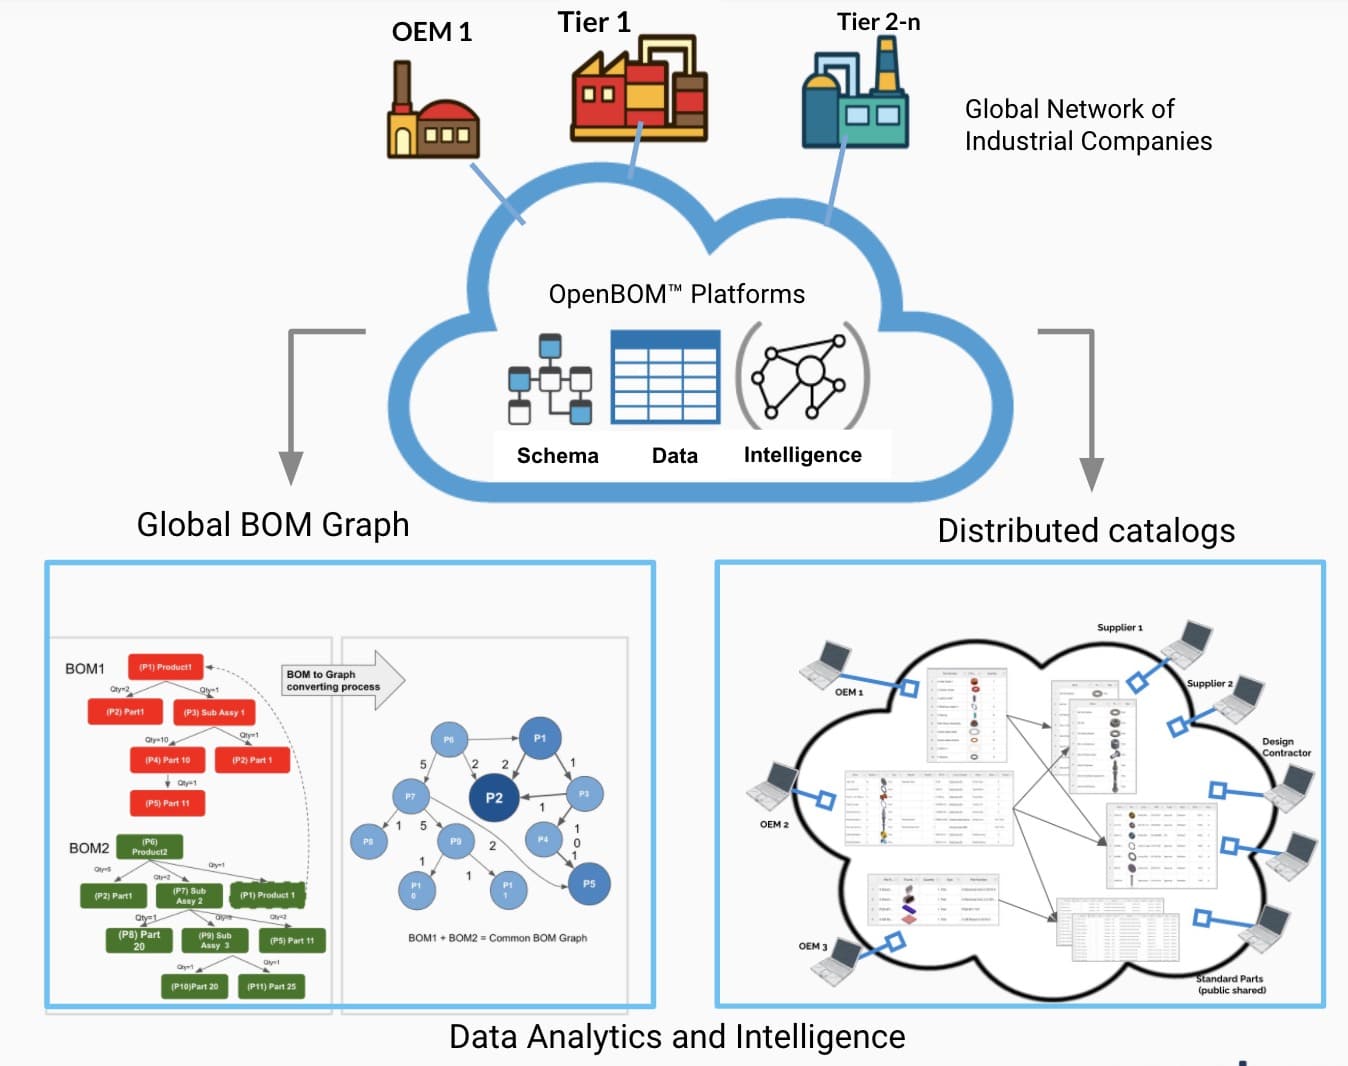
Data is a driving force behind decisions in the modern business environment including manufacturing. Manufacturing companies are sitting on a goldmine of data, which includes information about design, products, component usage, vendors, and much more. This structured information is actually represented by a variety of Bill of Materials (Design BOM, engineering BOM, manufacturing BOM, maintenance BOM, and others). Combining this information together can be an interesting technological and data management exercise that can help to find common elements and dependencies of the product structures and their components. Online multi-tenant platforms allowing OEMs, suppliers, and contractors to work together are the biggest facilitator of the process of combing BOMs into graphs.
How does the global BOM graph impact business decisions and strategies?
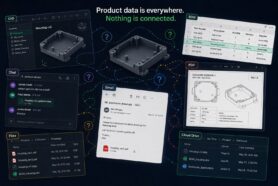
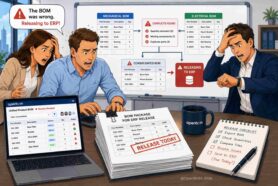
Manufacturing businesses are heavily interconnected these days – OEMs, suppliers, contractors, multiple components sources. All together this creates a network of information. This information is isolated and siloed. To analyze such silos is impossible, which results in companies making sub-optimal decisions about what suppliers to use, what components to choose and what products to develop for their customers.
A global BOM graph built from the data about products, component usage, assemblies, and all details collected alongside the value chain can provide huge benefits to all companies involved in the business relationships. It helps to turn manufacturing companies into data-centric businesses to support new innovative business models and to create a new type of company – data-driven manufacturing companies.
The information that can be extracted from the global BOM graph can provide risk analysis, supply chain bottlenecks, find alternatives for suppliers and components as well as optimize product scheduled and deliveries.
Evolution of global BOM Graph
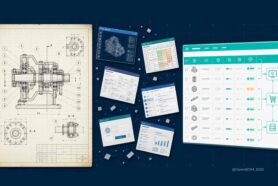
We are at the very beginning of the process to build intelligence data information for the future connected manufacturing businesses. This process is part of the overall digital transformation of manufacturing companies from a document-driven environment to a data-driven environment. The process contained extraction (digitalization) of information located in multiple places in manufacturing companies – enterprise systems, legacy databases, tons of Exel spreadsheets, and many others and convert them into the data and intelligent information that can be used for decision making. The initial elements of the global BOM graph will be covering specific functions (eg. cost analysis, supply chain, etc.). Within time, the global BOM graph will be covering more functions and business requirements.
OpenBOM and Global BOM graph
A connected multi-tenant data management foundation we developed at OpenBOM provides an infrastructure to create the bill of materials, item catalogs, import data from multiple systems, and convert it to a global BOM graph using modern data management technologies. It allows companies involved in business relationships to collaboratively build a data-centric environment that can be used for decision-making.
Conclusion
The modern manufacturing environment creates many challenges to manufacturing companies – increased global competition, resources availability, supply chain shortages. OpenBOM multi-tenant global platform allows manufacturing businesses, contractors, suppliers, and all involved parties to build a new connected data environment to help solve real manufacturing problems such as cost analysis, supply chain constraints, and many others. Interested to learn more? Contact us – we would be happy to discuss.
REGISTER FOR FREE to learn more about OpenBOM today.
Best, Oleg
Join our newsletter to receive a weekly portion of news, articles, and tips about OpenBOM and our community.